KitchenSync Food Forecasting System
Live kitchen production system. ML pulls furthest ahead of a naive baseline exactly when weather diverges from the seasonal norm — and reports honestly the one condition where it doesn't.
view on github ↗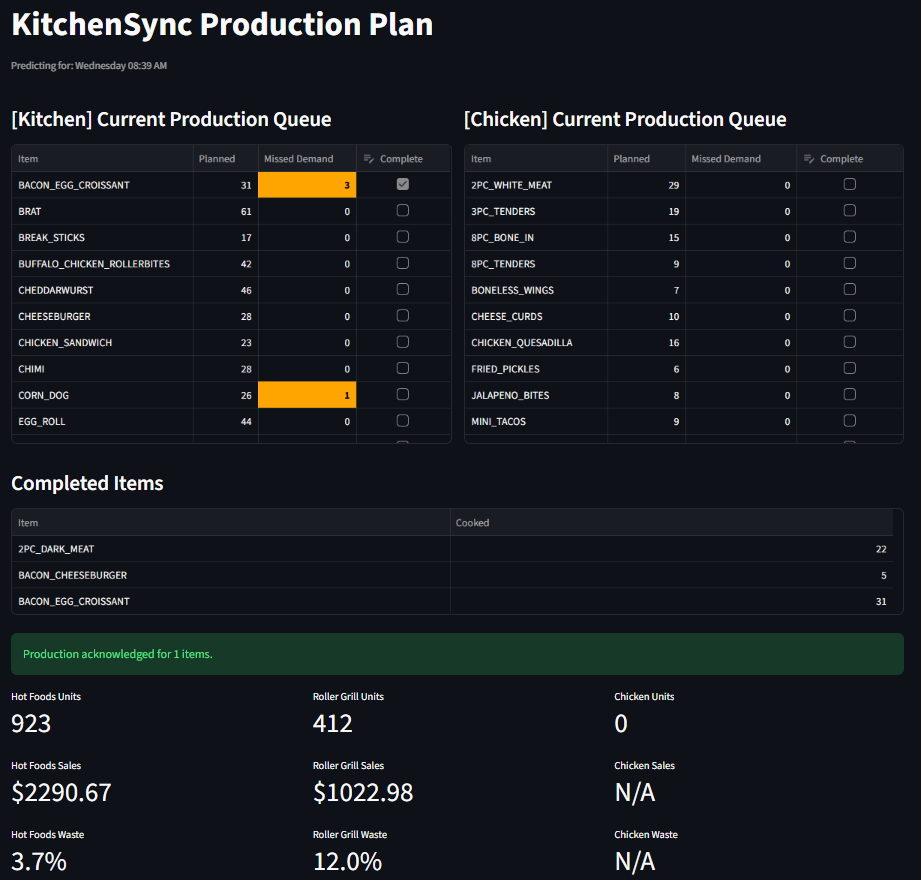
This is what kitchen staff cook from all shift — live Kitchen and Chicken production queues plus running waste and sales metrics, refreshed every 5 minutes.
Retail kitchens waste food when production outpaces demand and miss revenue when they run short. Forecasting the right quantity per item per store at a 15-minute grain, refreshed continuously, needs a real pipeline, not a spreadsheet — and the harder question is honest evaluation: does ML actually earn its complexity cost, and where does it not? Modeled after the Kitchen Production System (KPS) at Kwik Trip.
End-to-end simulation of a Kwik Trip-style Kitchen Production System running live on AWS EC2. The POS simulator generates events for 12 stores via Poisson arrivals, FIFO batch inventory, and slot-boundary production logic, buffering sales/waste/stockout in memory and flushing straight to Neon Postgres every 5 minutes — no ingest API in front of it. A nightly cron rebuilds the demand baseline and runs an A/B comparison entirely against Neon: LightGBM (fed real per-date, per-region weather as a "perfect forecast") against a naive hourly-average baseline that structurally can't use a weather axis, over 12 stores × 45 items × 672 weekly slots. A Streamlit dashboard surfaces split Kitchen and Chicken production queues with 5-minute auto-refresh, reading live from Neon. Results write to ab_results_v2.json, commit to GitHub, and trigger this portfolio site to rebuild. Retraining is manual and Neon-native end to end — no Snowflake step; a dbt project remains in the repo as a portfolio-only artifact, not run against live data.
- → Weather signal too weak to show up: the baseline's own historical average already bakes in an *average* weather effect, so a synthetic signal has to be deliberately stronger than reality to produce a visible A/B gap at all — narrowed the neutral band, raised precip probability, and halved unrelated day-to-day noise, growing the extreme-temperature service-level gap from +0.31pp to +2.0pp
- → Diagnosed a silent cost leak: an always-open ingest-API connection pool kept Neon's compute endpoint permanently awake, burning a week's free-tier compute-hours regardless of actual traffic — deleted the API entirely and rewrote the simulator to buffer events in memory and flush via short-lived batched connections every 5 minutes
- → Traced a 1.89x overproduction at a low-traffic store to a fleet-wide cold-start average masking per-store scale — fixed with a data-driven per-store traffic ratio and a three-tier warm/zero/cold fallback, flattening predicted-vs-actual to a 1.02–1.03x band across stores
- → Caught a conditional-mean trap: a demand profile averaging only sale-days instead of all days inflated low-traffic predictions 3–4x — a generalizable lesson now called out for any future profile-building script, not just a one-off fix
An earlier Power BI report built to explore the same data — kept as an archived artifact, not maintained or refreshed anymore. Stores ranked by waste % level, drill-through to individual store stats, and an item performance page sliced by category or store.